Supporting digital and commercial leaders in complex, technical B2B organisations.
Interactive touch screens presenting travel, weather and financial
data to live broadcast – developed in under three weeks.
Interactive touch screens presenting travel, weather and financial data to live broadcast - developed in under three weeks.

Supporting digital and commercial leaders in complex, technical B2B organisations.
data to live broadcast – developed in under three weeks.
London Live is a British television channel. Broadcasting news, current affairs, and entertainment, 24 hours per day on Freeview, satellite, cable, and online.
Six weeks before launch, London Live started running pilot broadcasts for the live morning, lunchtime, and evening news programmes. At that point, the limitations of the on-screen graphics system (Chyron) became apparent. To improve the content of the news programmes, London Live’s news team asked us to create interactive screens that would allow studio presenters to present real-time news, travel, weather, and financial data to live broadcast.
Our vision was to reuse the integrations we had completed for the web platform (weather, travel and traffic data, financial data, and curated social media) and bring this over to giant (84-inch) touchscreens that studio presenters could interact with during live broadcast.
"We had less than three weeks to develop the entire solution, before a planned technology freeze ahead of the London Live launch."
Stefan Finch
Technical Principal, Graph
Given the exceptionally tight timescales, we conducted daily on-site iterations with the London Live team. Each morning, we worked with presenters and producers to collect feedback from the studio team following the 6 am to 9 am pilot broadcast. Our global team then incorporated the feedback and developed the next iteration overnight, ready for testing at 6 am the following day.
We developed the solution a standalone React application that would store all data locally, to remove technology risks during live broadcast, and could be deployed to any computer connected to the 84-inch touchscreens.
Technologies
Leaflet.js
MapBox
Microsoft .NET
React.js
Methodologies
Product Design
DevOps & Test Automation
Timeline
The initial design sprints looked at typography, and colours, as these can change when broadcast. Also, we started to look at the information that studio presenters needed to convey, how presenters would interact with the screens, where they would stand, and how they would navigate between different ‘slides’.
An essential requirement was to allow presenters to queue up different combinations of slides into individually named ‘running orders’. These were to be created in advance of a live broadcast. These ‘running orders’ would allow the studio team to present any preset combination of slides at a moment’s notice, allowing producers to cut back to the studio from live outdoor broadcasts and move straight on to travel and weather.
To allow presenters to interact with the screens more effectively, we developed the technology solution to support a reduced set of custom touch gestures. The reduced set of interactions would remove the risk of error when presenting during a live broadcast. In addition, we also implemented support for a Bluetooth clicker that could be held by the presenter and used as a remote control.
A subsequent requirement was to add interactive maps to the studio screens. The studio maps would allow the London Live team to enhance their outdoor broadcasts – such as the Notting Hill Carnival – with news, video, and other content specific to a location.
We leveraged MapBox Studio to develop a custom mapping solution with broadcast compatible colours and a reduced level of information visible in the maps. We rendered the maps at several different zoom levels, exporting map sitemap as individual 8x8 squares that could be deployed to standard CDN and web servers.
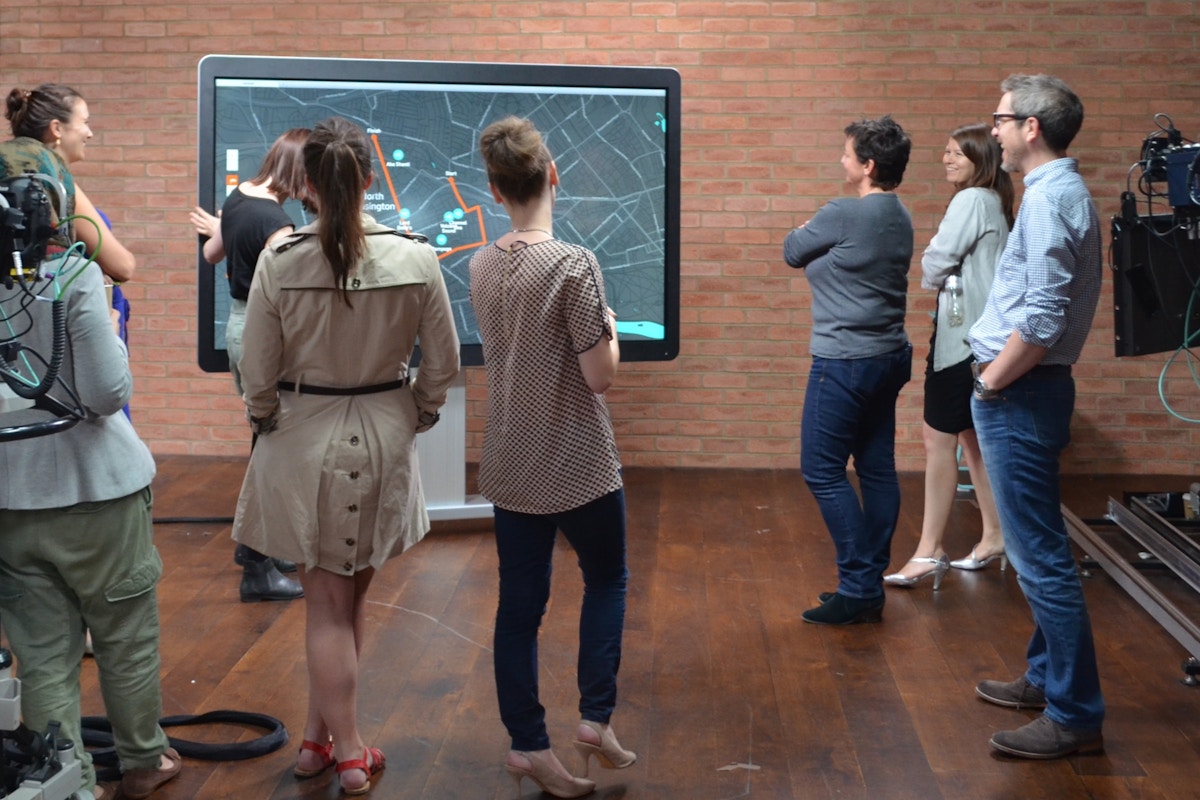
Studio team exploring the level of detail shown in the maps.
We incorporated Leaflet.js to develop the interactive map interface, with all map sitemap cached offline and ensured content management workflows captured spatial data. We extended the solution to support overlays within the maps – including polygon and vector overlays, such as the Notting Hill Carnival route map.
Testing how different presenters would interact with the studio maps.
Our interactive screens are used extensively during live broadcast every morning for the 6 am to 9 am breakfast show, the lunchtime news bulletin, and 5 pm to 7 pm evening news programmes. The studio maps enrich a weekly “what’s on” news programme as well as provide support for outdoor broadcasts.
“What the Graph team has brought together in our timeframe has been incredible. It’s a superb product that adds significant visual impact to our news and current affairs programming.”
Vikki Cook
Head of News and Current Affairs, London Live